
Evergreen guide · Definitions and sources checked on 1 October 2026.
An airline can carry more passengers, fill more seats and report record revenue while earning less money.
The reason is straightforward: traffic measures activity. Profitability depends on what the airline earns from that activity, what it costs to deliver, and how much capital the business requires.

Two measures help connect those questions: revenue per available seat kilometre, or RASK, and cost per available seat kilometre, or CASK.
Understanding their relationship reveals why apparently successful airlines can struggle financially—and why a carrier with higher costs can still produce stronger returns.
Start with what an airline produces
Airlines produce transport capacity. The standard passenger-capacity measure is the available seat kilometre, or ASK: one seat available for sale, flown one kilometre.
A flight with 200 available seats travelling 1,000 kilometres produces:
200 × 1,000 = 200,000 ASK
That capacity exists whether the aircraft carries 100 passengers or 200.
Passenger traffic is measured separately in revenue passenger kilometres, or RPK. If 180 paying passengers travel the same distance, the flight generates 180,000 RPK.
The passenger load factor is therefore:
Load factor = RPK ÷ ASK = 90%
Across a network, this is a distance-weighted measure of capacity sold, rather than a simple average of the percentage of seats occupied on each flight. These capacity and traffic concepts underpin airline unit economics. MIT Airline Data Project glossary
RASK and CASK: putting revenue and cost on the same basis
RASK measures the revenue generated by each unit of available capacity:
RASK = Revenue ÷ ASK
CASK measures the cost of producing that capacity:
CASK = Costs ÷ ASK
Both are commonly expressed in currency cents per ASK. Using the same denominator makes it possible to examine revenue and cost together as an airline expands or contracts.
For the operating-profit framework used here, revenue and costs cover the same airline business and period, with costs including depreciation. Published airline metrics can use different definitions, so their reconciliation matters. Lufthansa’s glossary gives the basic revenue-per-ASK and operating-expenses-per-ASK definitions. Lufthansa Group annual report, glossary
On a consistent basis:
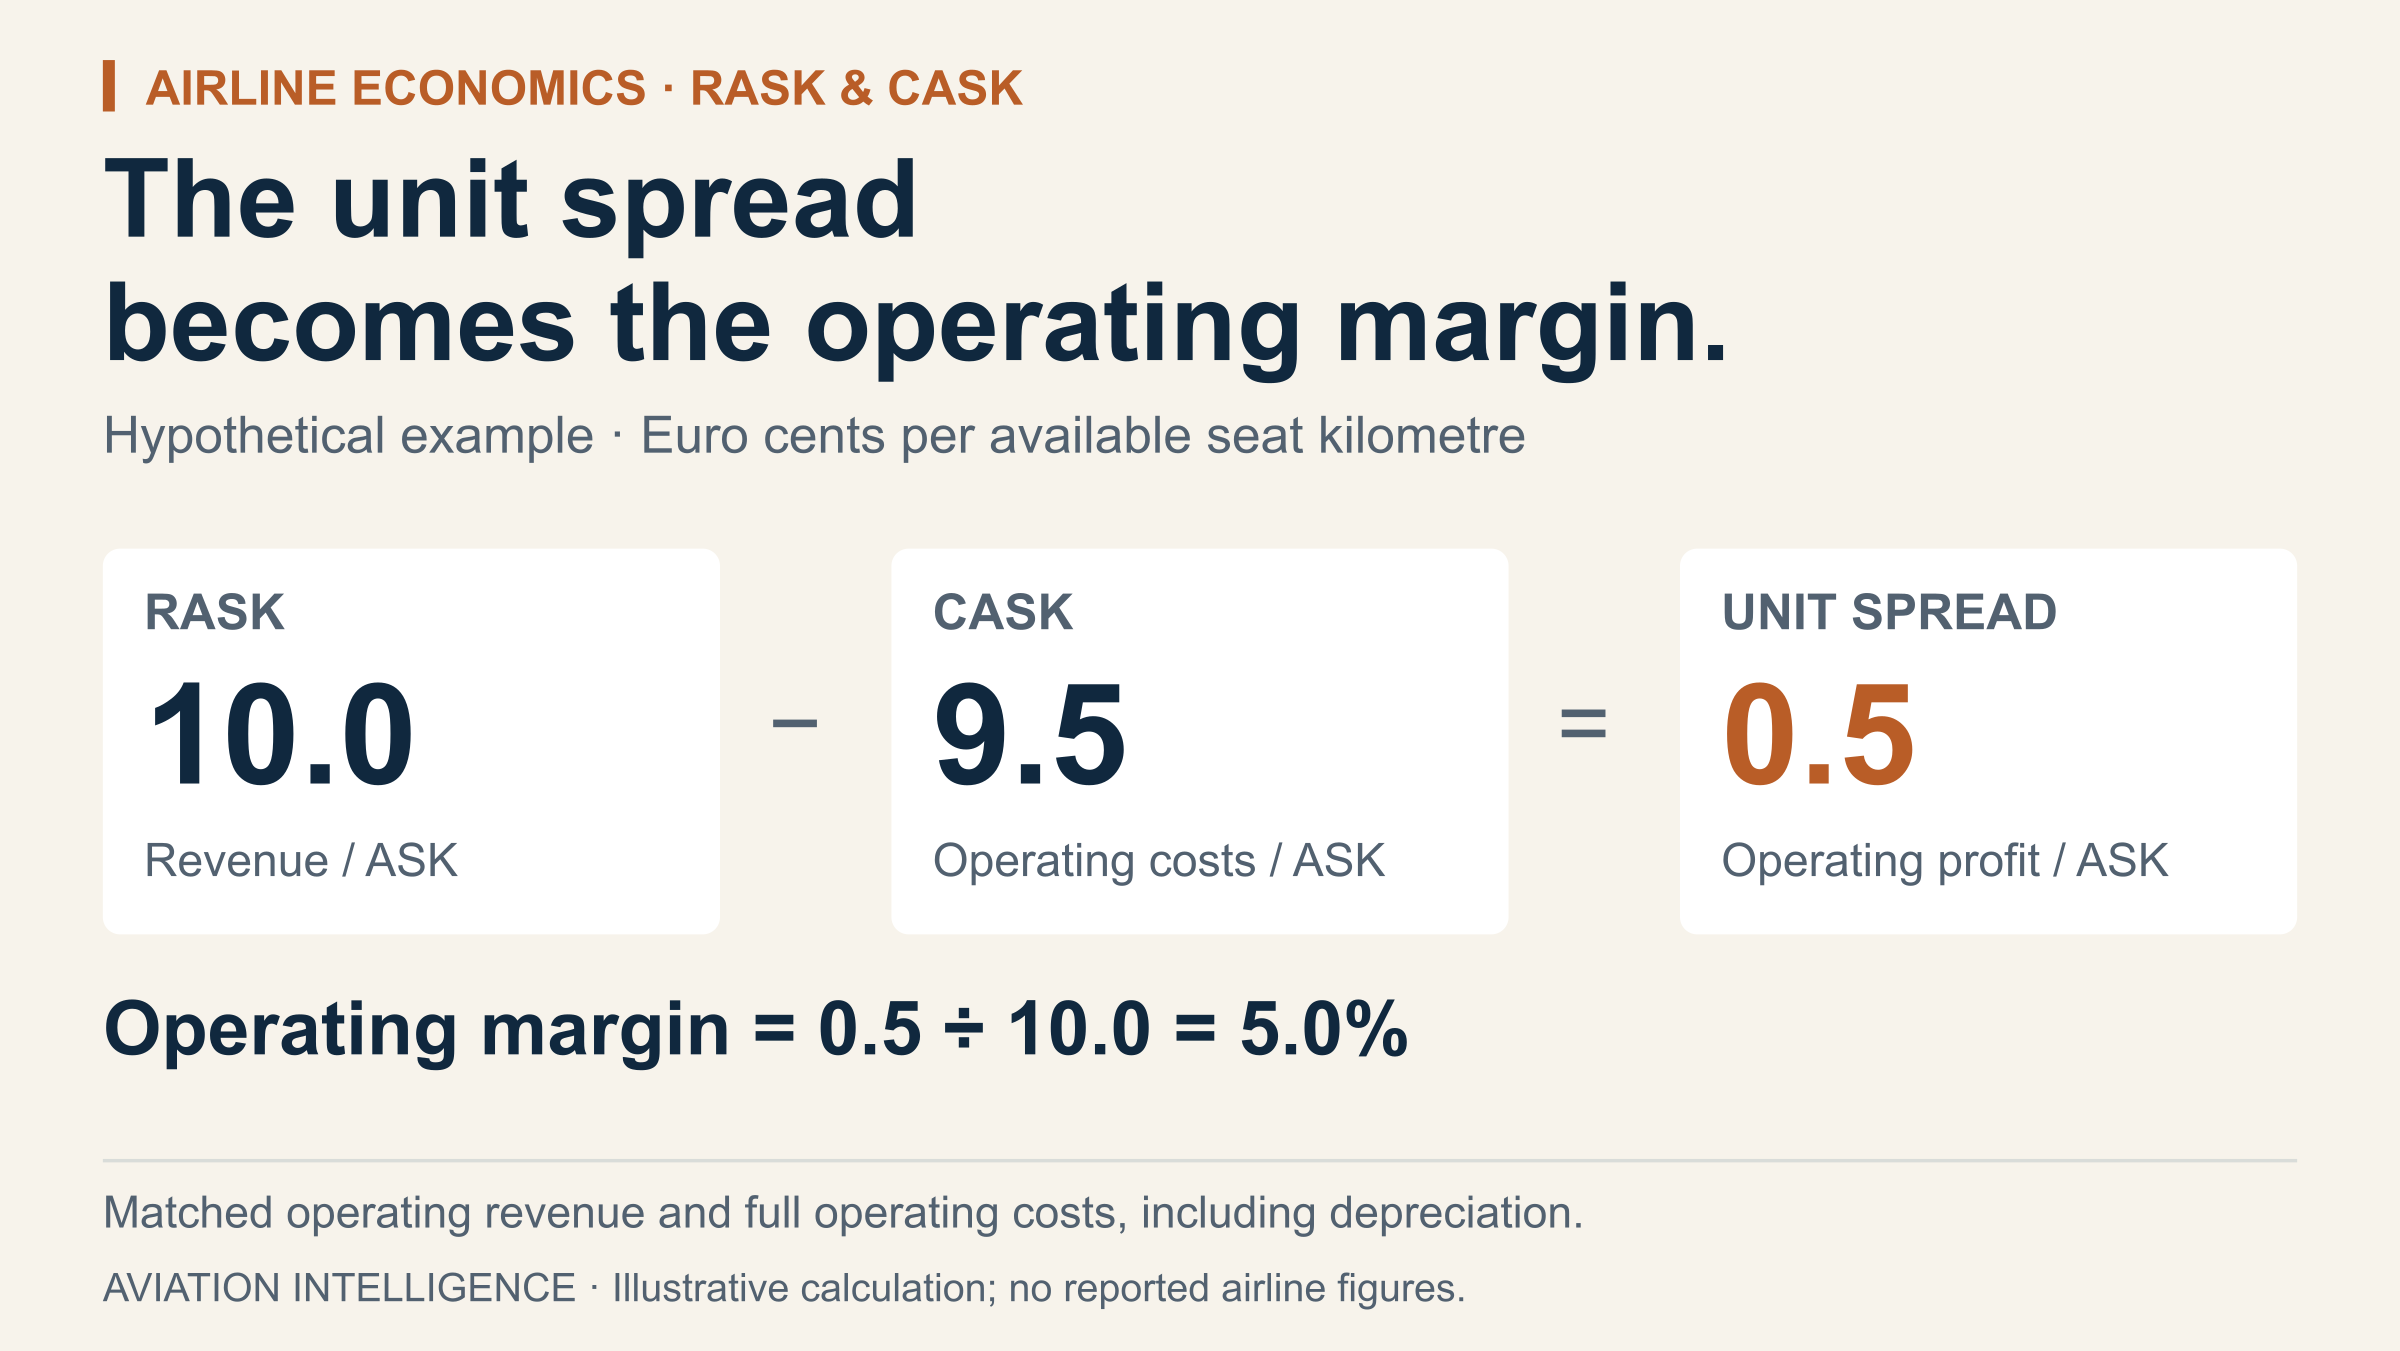
Operating profit per ASK = RASK − CASK
Multiplying that spread by capacity produces operating profit:
Operating profit = (RASK − CASK) × ASK
Margin answers a different question: how much of each unit of revenue remains as profit?
Operating margin = Operating profit ÷ Revenue
Under the same matched definitions:
Operating margin = (RASK − CASK) ÷ RASK
A spread of 0.5 cents per ASK is a monetary amount per unit of capacity. It becomes a 5% operating margin when RASK is 10 cents.
How small changes can erase most of the profit
Consider this hypothetical airline. Capacity remains unchanged in both scenarios, and all revenue and operating costs are included.
| Measure | Starting position | After revenue and cost pressure |
|---|---|---|
| Capacity | 10 billion ASK | 10 billion ASK |
| RASK | 10.00 euro cents | 9.70 euro cents |
| CASK | 9.50 euro cents | 9.69 euro cents |
| Revenue | €1.000 billion | €970 million |
| Operating costs | €950 million | €969 million |
| Operating profit | €50 million | €1 million |
| Operating margin | 5.0% | Approximately 0.1% |
RASK falls by 3%, while CASK rises by 2%. Operating profit falls by 98%.
The airline still generates almost a billion euros of revenue. Its economics have nevertheless deteriorated sharply.
This is why the starting spread matters so much: modest movements in revenue or costs can consume a large proportion of a thin margin.
Why a full aircraft can lose money
Load factor tells us how much capacity an airline sells. It does not tell us the price achieved.
That requires passenger yield:
Passenger yield = Passenger revenue ÷ RPK
Using consistent passenger-revenue definitions:
Passenger RASK, or PRASK = Passenger yield × Load factor
The same relationship applies to the equivalent seat-mile measures used by US airlines. MIT Airline Data Project glossary
Suppose passenger yield is 10 cents per RPK and load factor is 90%. Passenger RASK is:
10 × 90% = 9.0 cents per ASK
Now suppose discounting raises load factor to 95% but reduces average yield to 9 cents. Passenger RASK becomes:
9 × 95% = 8.55 cents per ASK
The aircraft is fuller, but passenger revenue per unit of capacity is lower.
Selling an otherwise empty seat can still improve profit when the additional revenue exceeds the additional cost and does not displace a more valuable booking. Revenue management must balance those opportunities: attract additional demand while preserving seats for passengers willing to pay more. MIT material on airline revenue management
There is no universal profitable load factor
In a simplified passenger-only model:
Break-even load factor = CASK ÷ Passenger yield
At CASK of 8 cents and yield of 10 cents, break-even load factor is 80%.
That calculation holds costs and yield constant and excludes other revenue. Actual break-even conditions change with fares, passenger-related costs, cargo and ancillary income. A load factor that supports a strong profit for one airline can leave another below break-even.
What strengthens the revenue side?
An airline improves RASK when it earns more revenue relative to the capacity it supplies. Several choices influence that outcome.
Pricing and passenger mix. The average revenue collected depends on who travels, when they book, which cabin they use and how much they value the schedule. A premium product creates value when its additional revenue exceeds its additional cost.
Ancillary services. Baggage, seat selection and other optional purchases can increase revenue from each journey. Their contribution should be assessed after the associated costs. Reporting definitions also matter: some airlines already include certain ancillary services within passenger revenue, so adding them separately would double-count them.
Network and schedule. Capacity has different commercial value at different airports, departure times and seasons. Route planning must consider demand, costs and the effect on the existing network. IATA route forecasting and development
Cargo and other activities. Revenue carried alongside passenger services can support flight economics. At group level, businesses such as holiday operations can also contribute profit. Those results need to be distinguished from airline unit economics: easyJet, for example, separates its airline RASK from its holidays business. easyJet annual report, financial review
The useful question is how each source of revenue contributes to the result after its costs and capacity requirements.
What strengthens the cost side?
CASK reflects both the resources an airline uses and the amount of capacity over which it spreads their cost.
Several mechanisms can improve it:
- Higher productive utilisation: more useful flying spreads certain fleet and overhead costs across more capacity.
- Fleet and operating simplicity: fewer combinations of aircraft, procedures and support requirements can reduce complexity.
- Seat density: additional seats increase ASK, although the commercial effect depends on demand and the product offered.
- Better operational reliability: fewer disruptions can reduce recovery costs and protect the planned schedule.
These choices involve trade-offs. A tightly scheduled aircraft may achieve high utilisation but leave little room to recover from delays. Disruption can then affect aircraft, crews and passengers across subsequent flights. MIT material on airline operations and schedule recovery
A lower CASK can reflect a different operation
Average flight distance—known as stage length—is especially important.
Longer flights generally spread costs associated with each departure across more seat kilometres. A shift towards longer sectors can therefore reduce CASK without an equivalent improvement in underlying operating efficiency.
Seat density also changes the denominator. IATA’s cost-comparison methodology explicitly adjusts for both stage length and seating configuration. IATA Airline Cost Performance study
This makes raw CASK rankings difficult to interpret. A meaningful comparison needs comparable routes, products, capacity definitions and accounting treatment. Currency, reporting period, revenue mix and adjusted versus reported measures also need to match.
Why airlines report CASK excluding fuel
Removing fuel helps analysts examine changes in the remaining cost base. Some measures remove additional items: Lufthansa’s passenger-airline reporting, for example, excludes fuel and emissions trading expenses. Lufthansa Group annual report, passenger-airline metrics
The excluded costs still have to be paid.
A profitable-looking gap between total RASK and CASK excluding fuel cannot establish profitability. The complete cost base must be restored first.
Growth helps when the additional flying earns its place
Capacity growth can spread overheads and increase total profit. It can also introduce flights that require lower fares, higher costs or substantial investment.
The relevant decision is whether the additional flying improves the airline’s total economic result.
An airline should assess the revenue and avoidable costs of the expansion, its effect on existing services, and the additional fleet and working capital required. A connecting service may support revenue elsewhere in the network, so its contribution can extend beyond its own flight.
Average RASK and CASK remain useful, but they can conceal changes beneath the surface. Profitable mature routes may offset weak new capacity; a favourable network mix may mask rising costs.
Growth deserves closer examination when it improves reported unit costs while weakening margins or consuming more capital.
Operating profit is one part of sustainable profitability
A positive operating spread answers whether the airline earns more from its operation than the corresponding operating costs.
Two further tests matter.
Net profitability. Financing costs, taxes and other non-operating items affect what remains after operating profit. An airline with positive operating earnings can still report a net loss.
Cash generation and capital returns. Aircraft purchases, deposits, maintenance requirements and debt repayments create cash demands that an operating margin alone cannot describe. Cash received from advance bookings also precedes the obligation to carry those passengers.
Finally, the airline must earn an adequate return on the capital committed to it. Positive accounting profit can coexist with returns below the cost of capital—a distinction IATA makes explicitly in its financial outlooks. IATA discussion of profitability and capital returns
When reading airline results, five questions bring these elements together:
- Is revenue per unit of capacity improving relative to the full cost of supplying it?
- Is that movement explained by pricing, occupancy, productivity or a change in the network?
- Do the reported RASK and CASK definitions reconcile to the profit being discussed?
- Does additional capacity improve total profit after its wider effects?
- Does the business generate sufficient cash and returns to support its capital requirements?
RASK and CASK provide the starting point. Sustainable profitability comes from selling the right capacity at an adequate price, delivering it reliably at a controlled cost, and earning enough to finance the assets behind the operation.
Explore airline unit economics
Apply this framework to the RASK and CASK comparison and the operating-margin database. Both should be read alongside the reporting periods, metric definitions and source notes.
For a broader framework, see our guide to reading airline results and assessing growth quality or use the airline comparison tool to inspect financial performance, traffic and fleet data together.
Methodology and scope
This evergreen guide explains relationships between capacity, revenue, operating costs and profitability. All numerical examples and the lead graphic are hypothetical Aviation Intelligence calculations; they are not forecasts or reported airline results. The operating-profit identities require a matched revenue and cost basis that reconciles to operating profit, including any separate operating income. The break-even load-factor example holds yield and costs constant and excludes other revenue. Company reports are used to verify definitions and reporting boundaries. Historical industry and teaching sources support enduring economic principles, rather than current market conditions.
Primary sources
- MIT Airline Data Project: glossary of airline financial, traffic and capacity measures
- Lufthansa Group Annual Report 2025: glossary and passenger-airline reporting definitions
- easyJet Annual Report and Accounts 2025: airline and holidays reporting boundaries
- IATA Airline Cost Performance: stage-length and seat-density adjustments
- MIT OpenCourseWare: airline revenue management
- MIT OpenCourseWare: airline operations and schedule recovery
- IATA: route forecasting and development
- IATA: discussion of profitability and the cost of capital, December 2025
Leave a Reply