
Analysis date: 27 September 2026
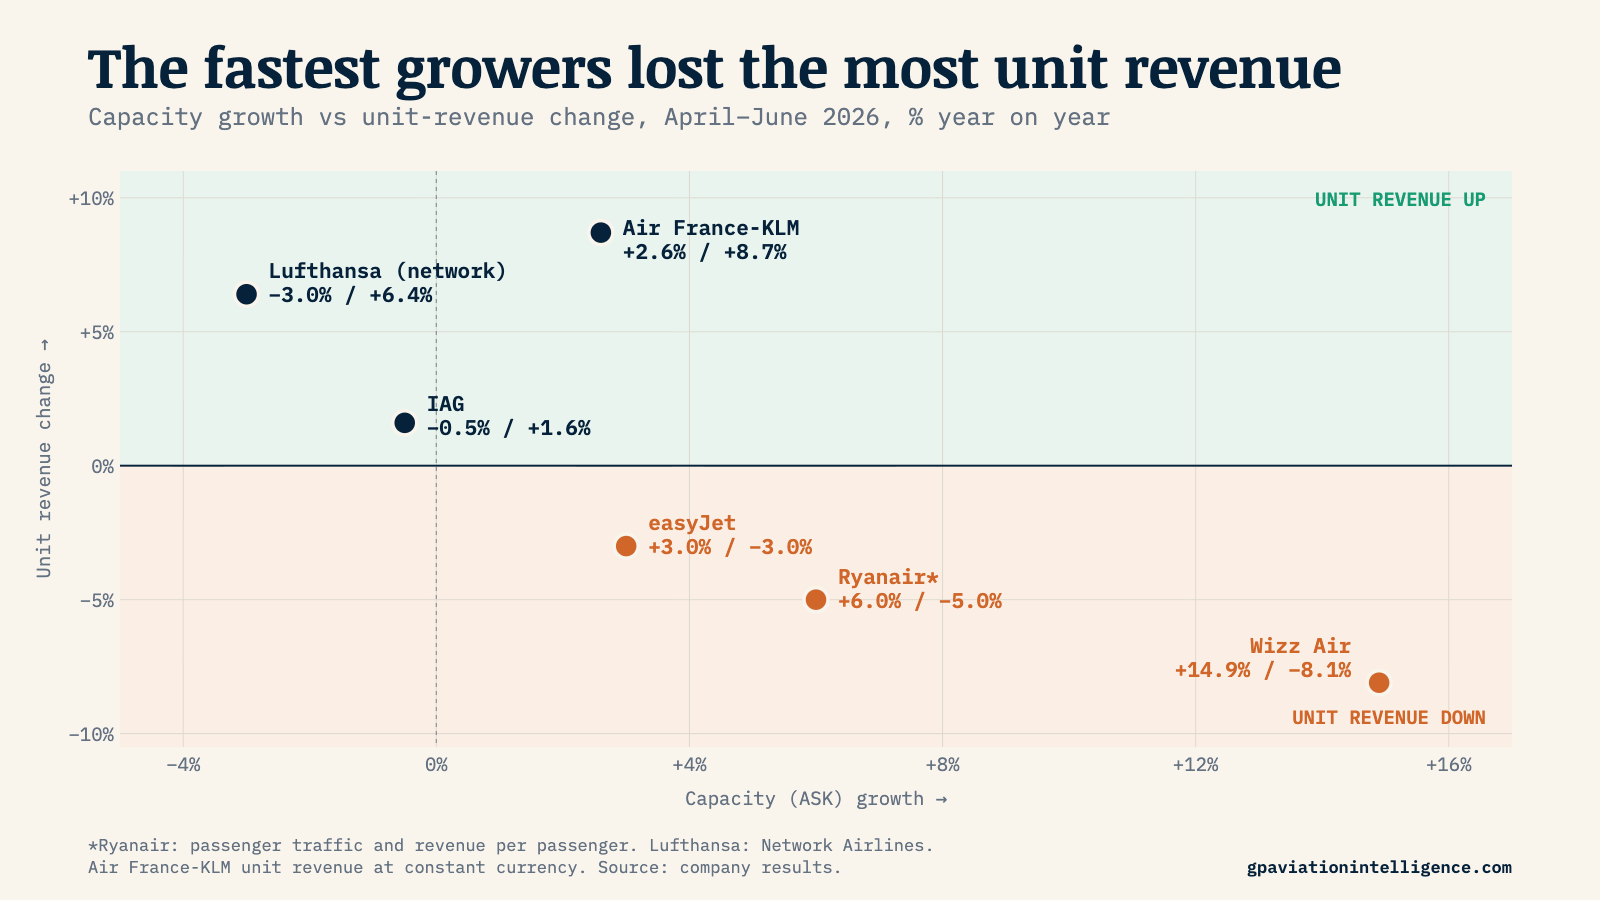
Wizz Air added 14.9% more capacity in the June quarter. Lufthansa‘s network airlines flew 3% less. Yet it was Lufthansa, IAG and Air France-KLM that earned more from every seat, while the three fastest growers all earned less.
That is the question behind the first Aviation Intelligence Growth Quality Monitor: not how much each airline grew, but how well it turned the extra flying into revenue, unit economics and profit.

The split is unusually clean. The three network groups held or cut capacity and raised unit revenue. Ryanair, easyJet and Wizz Air grew faster and saw unit revenue fall — and the faster they grew, the further it fell.
What we mean by growth quality
An airline can add aircraft, seats and passengers while its economics get worse. Revenue can rise while revenue per seat falls; load factor can stay above 90% while margins shrink. The monitor follows the chain from capacity → revenue → unit economics → profit and asks three questions:
- Growth conversion: is revenue rising at least as fast as capacity?
- Unit spread: is unit revenue improving relative to unit cost?
- Profit conversion: does the extra flying end up as operating profit?
There is deliberately no composite score, because airline disclosures are not standardised. The framework builds on our guide to reading airline results and the site’s Growth Tracker, RASK & CASK comparison and operating-margin database.
IAG: no growth, better economics
IAG is the clearest counterexample to the idea that airlines must keep adding capacity to improve. Group ASKs fell 0.5% in Q2, yet passenger revenue per ASK rose 1.6% and non-fuel CASK fell 1.7%. On almost flat revenue of €8.88bn, operating profit before exceptional items reached €1.41bn — a 15.8% margin, down from an unusually strong 19.0% but still the highest in this comparison.
Fuel still cost IAG almost €500m of operating profit year on year. Management has since cut 2026 capacity guidance to roughly flat, which makes the strategy explicit: protect economics first, and add seats only where returns justify it.
Air France-KLM: modest growth, powerful pricing
Air France-KLM grew ASKs only 2.6% and passengers 3.9%, but revenue rose 9.9% to €9.28bn. Group unit revenue climbed 8.7% at constant currency against a 1.0% rise in unit cost, helped by premium demand and strength on Asia and North America routes. Commercially, that is what high-quality growth looks like.
Fuel took much of it back. The group estimated an €804m fuel-price headwind and recovered around 85% through revenue, but adjusted operating profit still fell to €484m, a 5.2% margin. The commercial engine was strong; the benefit was lost below the revenue line.
Lufthansa: strong pricing, weak profit conversion
Lufthansa Group revenue rose 8% to €11.1bn. Its Network Airlines offered 3% less capacity, yet unit revenue rose 6.4% and load factor edged up to 81.6%. At the top of the income statement, that is strong conversion.
The problem came further down. Adjusted EBIT fell to €383m from €870m, a 3.4% margin, after roughly €750m of extra fuel cost and at least €150m from strikes. Network-airline unit costs excluding fuel and emissions also rose 3.1%, partly because fixed costs were spread over fewer ASKs. This is not a demand problem; it is a cost-conversion problem.
Ryanair: profitable growth, thinner revenue
Ryanair carried 61.3m passengers in Q1 FY27, up 6%, but revenue rose only 1% to €4.38bn as revenue per passenger fell 5% and the average fare 6%. Traffic grew six times faster than revenue. Profit after tax of €538m was still healthy, but down 34% as operating costs rose 11% and the unhedged fifth of its fuel became far more expensive.
Ryanair can afford to buy volume with price: around 80% of FY27 fuel is hedged near $67 a barrel, the fleet is largely owned and its cost base is the lowest of the group. But even Ryanair shows the monitor’s central point — volume growth is not automatically economic growth. We compared its cost advantage directly with easyJet and Wizz Air in One quarter, three outcomes.
easyJet: squeezed from both sides
easyJet grew ASKs 3% and carried 25.8m passengers, but RASK fell 3% while headline CASK excluding fuel rose 3% and fuel CASK 13%. Lower revenue and higher cost per unit at the same time is one of the least attractive combinations in airline economics; headline profit before tax fell to £85m from £286m.
The offset is easyJet holidays, which earned £84m of headline PBT — almost as much as the whole group. That earnings stream does not show up in airline RASK and CASK, and it makes easyJet one to watch: the question is whether the group can keep raising profit per aircraft even when airline unit revenue is under pressure.
Wizz Air: exceptional growth, poor conversion
No airline in the set shows the gap between growth and growth quality more clearly than Wizz Air.
- Fleet: +13.1% · ASK capacity: +14.9% · Passengers: +25.1%
- Revenue: +5.5% · RASK: −8.1% · Total CASK: +5.1%
Capacity grew almost three times faster than revenue while each ASK became more expensive to fly, and a €27.5m operating profit became a €183.3m loss. The nuance: ex-fuel CASK actually fell 1.9%, so this is not a collapse in cost discipline. The damage came from lower RASK, fuel CASK up 21.3% and depreciation pressure while GTF engine problems kept aircraft on the ground.
Fast growth can be rational if it secures market positions that pay back later. But the capacity has to convert into revenue and profit eventually — and in this quarter it did not.
The conversion gap
The simplest test is to subtract capacity or traffic growth from revenue growth. It is not perfectly like-for-like, but it shows whether the top line is keeping pace with production.

The spread is wide enough to matter despite the caveats: Air France-KLM generated 7.3 points more revenue growth than capacity growth, while Wizz Air’s capacity outran its revenue by 9.4 points.
Fuel distorts the quarter — but does not invalidate it
Jet fuel prices, pushed up by the Middle East conflict, hit every airline in the set: roughly €750m of extra cost at Lufthansa, an €804m headwind at Air France-KLM, fuel CASK up 13% at easyJet and 21.3% at Wizz Air, and an 11% rise in Ryanair’s operating costs. We set out the wider exposure in Europe’s airlines face a prolonged profit squeeze if oil stays above $100.
That does not weaken the monitor. Growth quality is about converting demand into profit after fuel, labour, fleet and financing costs are paid. Volatile fuel is part of the business model, not something outside it.
Two strategies, one question
The network groups are competing on yield and capacity discipline; the low-cost carriers are still competing on volume. Slow growth is not always better — an airline can rationally accept lower yields to build a market or exploit a cost advantage, and one quarter is not a trend. But passenger records need context. The number that matters is not how many more people an airline carried, but what happened to the revenue and cost of carrying each extra one.
What to watch next
The next reporting cycle should answer five questions:
- Can Wizz Air close the conversion gap? With capacity still growing fast, RASK is the number to watch.
- Do Ryanair fares recover as traffic growth slows? Stable fares on continued volume growth would change the picture materially.
- Can easyJet get RASK back to flat without cutting capacity? Even a small move would shift the economics quickly.
- Do Lufthansa and Air France-KLM keep their pricing? Part of the June-quarter yield came from network disruption and constrained Gulf capacity.
- Does IAG keep choosing returns over volume? Flat 2026 capacity makes it the clearest test of discipline.
Reporting dates are in the Aviation Intelligence airline earnings calendar.
Methodology
This edition uses the latest reporting periods covering April–June 2026. Definitions differ: Ryanair reports traffic and revenue per passenger rather than ASK and RASK; Lufthansa reports several unit metrics at segment level; easyJet group earnings include easyJet holidays; and the groups treat adjusted and reported profit differently. The monitor therefore reads direction and relationships rather than precise rankings, and the same framework will be kept in future editions so changes become comparable over time.
Primary sources
- International Airlines Group, H1 / Q2 2026 results
- Air France-KLM, Q2 2026 results
- Lufthansa Group, Q2 2026 results
- Ryanair Holdings plc, Q1 FY27 results (quarter ended 30 June 2026)
- easyJet plc, Q3 FY26 trading statement (quarter ended 30 June 2026)
- Wizz Air Holdings plc, F27 Q1 results (quarter ended 30 June 2026)
- Aviation Intelligence: Airline comparison tool, Growth Tracker, RASK & CASK comparison and Operating margins
- Aviation Intelligence: One quarter, three outcomes: Ryanair, easyJet and Wizz Air in the June quarter
Figures are company-reported as cited above except where marked as Aviation Intelligence calculations. Currencies are not converted. Reporting definitions and fiscal calendars differ, so comparisons are directional rather than fully like-for-like. This article is for information purposes and is not investment advice.
Tables and key figures
Growth-quality snapshot, April–June 2026
| Airline | Capacity / volume | Unit revenue | Earnings |
|---|---|---|---|
| IAG | ASK −0.5% | PRASK +1.6% | Operating margin 15.8% |
| Air France-KLM | ASK +2.6% | Unit revenue +8.7% cc | Adjusted margin 5.2% |
| Lufthansa Group | Network capacity −3% | Network unit revenue +6.4% | Adjusted EBIT margin 3.4% |
| Ryanair | Traffic +6% | Revenue/pax −5% | PAT €538m (−34%) |
| easyJet | ASK +3% | RASK −3% | Headline PBT £85m (vs £286m) |
| Wizz Air | ASK +14.9% | RASK −8.1% | Operating loss €183.3m |
Growth-conversion gap (calculated)
| Airline | Capacity / volume growth | Revenue growth | Conversion gap |
|---|---|---|---|
| Air France-KLM | ASK +2.6% | +9.9% | +7.3pp |
| IAG | ASK −0.5% | +0.2% | +0.7pp |
| Ryanair | Traffic +6% | +1% | −5.0pp |
| Wizz Air | ASK +14.9% | +5.5% | −9.4pp |
Leave a Reply