
Analysis date: 13 October 2026
Put three airline results releases side by side and they rarely line up. Delta Air Lines, Lufthansa Group and Ryanair all reported on the same three months, April to June 2026, yet they gave the quarter different names, measured profit three ways and expressed unit cost per seat mile, per seat kilometre and per passenger. None of this is a reporting error. It follows from how airline disclosure works.

Only part of an airline’s results is standardised
Accounting standards govern the financial statements: revenue, operating expenses, operating profit and net income. Delta reports under US GAAP; Lufthansa and Ryanair report under IFRS. Almost everything analysts actually use to judge an airline sits outside those statements: load factor, unit revenue, unit cost, yield, passenger counts and “adjusted” profit. These are management metrics. Each company chooses which ones to publish, how to define them and when to change the definition.
Regulators shape the presentation rather than the content. Delta, as a US registrant, must reconcile every non-GAAP figure to its nearest GAAP equivalent, which is why its release carries several pages of reconciliations. Lufthansa leads with Adjusted EBIT, its long-standing steering metric. Ryanair publishes its IFRS income statement with no adjusted operating profit at all, so the statutory figure is the headline.
Same three months, three labels
Delta and Lufthansa run calendar years, so April to June is their second quarter: Q2 2026. Ryanair’s financial year ends on 31 March, so the same months are the first quarter of FY27. easyJet, with a September year-end, calls them the third quarter of FY26. The results also arrive weeks apart: Delta on 10 July, Ryanair on 20 July and Lufthansa on 4 August.
Labels matter because airline earnings are seasonal. A “Q1” from a March year-end carrier is a summer quarter; a calendar-year Q1 is winter. Comparing quarter numbers rather than months mixes the strongest season of one airline with the weakest of another.
What counts as operating profit
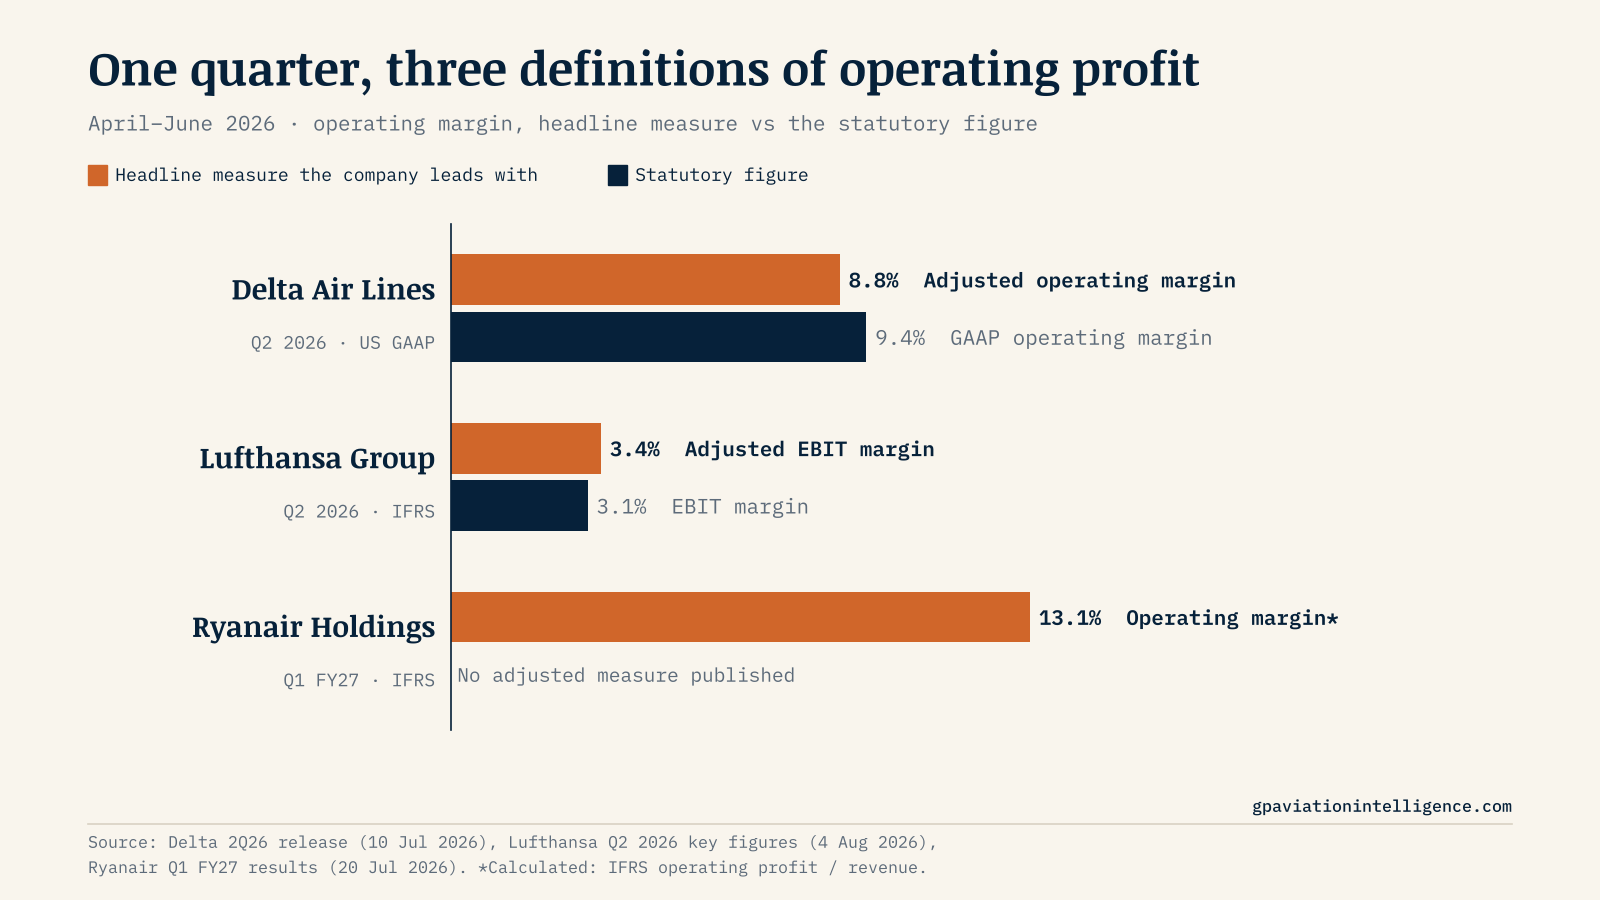
Delta’s adjusted operating income of $1,563m is $301m lower than its GAAP figure of $1,864m. The adjustment removes mark-to-market and settlement effects on hedges. Delta also removes $2,091m of third-party refinery sales from revenue, because its Monroe Energy refinery is not an airline business. On that basis the adjusted margin is 8.8%, against 9.4% under GAAP. Here the adjusted measure is the more conservative one.
Lufthansa’s Adjusted EBIT of €383m compares with EBIT of €346m, margins of 3.4% and 3.1%. The group figure also blends very different businesses: the network airlines earned €137m Adjusted EBIT, Eurowings and the other point-to-point airlines lost €37m, Lufthansa Technik earned €157m and Lufthansa Cargo €116m.
Ryanair reported IFRS operating profit of €575.4m on revenue of €4,384.1m, a 13.1% margin, and profit after tax of €538m. It has no maintenance or cargo arm to separate out and publishes no adjusted operating measure. Its 80% fuel hedge at about $67 a barrel runs through the reported numbers rather than being stripped out.
So the three margins in the lead chart are not three readings of one gauge. Delta’s excludes hedge timing and its refinery; Lufthansa’s excludes items it classes as non-recurring and includes MRO and cargo; Ryanair’s is the statutory figure.
Unit cost: three yardsticks
Unit cost shows the problem most clearly. All three airlines reported cost growth for the quarter, but each divided a different cost base by a different denominator.

Delta’s CASM-Ex rose 6.8% to 14.09 cents per available seat mile. It excludes fuel and related taxes, third-party refinery costs, third-party MRO expense and profit sharing, under an updated definition that the release footnotes. Lufthansa’s network airlines reported unit costs excluding fuel and emissions up 3.1%, and noted that at last year’s capacity the rise would have been about 1%: a strike-hit 3% capacity cut spread fixed costs over fewer seats. Ryanair said its unit costs rose 5%, measured per passenger and including fuel; stripping out fuel and oil, our calculation gives about +1.7% per passenger.
Read naively, Lufthansa looks like the cost leader of the three and Delta the laggard. In reality the numbers answer different questions. A per-passenger measure falls when aircraft fly fuller or longer sectors carry more people; a per-seat measure falls when the same costs are spread over more seats or longer stage lengths.
Capacity in miles, kilometres or passengers
Delta flew 78,694m available seat miles in the quarter. Converted at 1.609344 kilometres per mile that is about 126,600m available seat kilometres, compared with Lufthansa Group’s 86,939m ASK. Ryanair’s quarterly results do not include seat capacity at all; it reports 61.3m passengers and a 94% load factor.
Load factor itself varies in scope. Delta’s 84.8% is a mileage-weighted system figure. Lufthansa gives 82.5% for the group and 81.6% for its network airlines. Ryanair’s 94% is a rounded figure in a highlights table. Even “passengers” can differ: where airlines count passengers per flight segment, a traveller connecting through a hub is counted twice, while a point-to-point passenger usually flies a single segment.
The business model decides the spotlight
Companies put forward the metrics that explain how they make money. Delta highlights that premium ticket revenue grew 17% and that 61% of adjusted revenue came from premium products and other diversified streams, including $1,344m of loyalty revenue and $2.4bn of American Express remuneration. Lufthansa reports by segment because MRO and cargo are large businesses in their own right, and in this quarter they cushioned the fuel shock. Ryanair leads with traffic, fares (down 6%), ancillary revenue (€24 per passenger) and its fuel hedge, the levers of a low-fare model.
None of these choices is neutral. A metric is published because it tells the story management wants investors to follow, and definitions tend to change when the old one stops flattering the business. The reconciliation tables and footnotes are where the comparison really starts.
How to compare airlines fairly
- Align by months, not quarter labels. Map every fiscal period to calendar months before comparing.
- Anchor on the statutory figure. Use GAAP or IFRS operating profit as the common base, then read each adjusted measure against its reconciliation.
- List the exclusions. Fuel, emissions, refinery, MRO, profit sharing, hedge timing and special items are treated differently by each airline.
- Convert units. One available seat mile equals 1.609344 available seat kilometres; per-seat and per-passenger measures cannot be converted into each other without capacity data.
- Check scope. Group figures can include cargo, maintenance, catering or holidays; airline segments may not.
- Mind stage length and currency. Longer flights lower unit cost per seat kilometre, and a dollar cent is not a euro cent.
These are the rules applied in the Aviation Intelligence airline comparison tool, which labels every figure as reported, calculated or derived and keeps each airline’s own period label.
What to watch next
- Third-quarter results. Lufthansa’s Q3 report and Ryanair’s H1 FY27 results will show whether the same definitions hold through the peak summer quarter.
- IFRS 18 from January 2027. The new standard reshapes the income statement into operating, investing and financing categories and requires companies to disclose and reconcile management-defined performance measures such as Adjusted EBIT. Ryanair’s latest notes describe the presentation impact as considerable.
- Definition changes. Delta’s release already flags an updated CASM-Ex definition. Watch release footnotes for further changes, especially as fuel and emissions costs move.
Methodology
All figures are for the three months to 30 June 2026 and are taken from the companies’ results releases and key-figure tables. Margins for Ryanair, Ryanair cost per passenger (total and excluding fuel and oil) and Delta’s seat-kilometre conversion are calculated by Aviation Intelligence and marked as such. Currencies are not converted. Percentage changes are year on year against the same months of 2025.
Primary sources
- Delta Air Lines, June Quarter 2026 Financial Results (10 July 2026)
- Lufthansa Group, second-quarter 2026 results release (4 August 2026)
- Lufthansa Group, Key figures Q2 2026
- Ryanair Holdings plc, Q1 FY27 Results (quarter ended 30 June 2026)
Figures are company-reported as cited in the primary sources above, except where marked as calculated. Currencies are not converted. Unit revenue and unit cost measures are company-defined and not comparable across carriers without adjustment. This article is for information purposes and is not investment advice.
Tables and key figures
Reporting calendar
| Metric | Delta Air Lines | Lufthansa Group | Ryanair |
|---|---|---|---|
| Period label | Q2 2026 | Q2 2026 | Q1 FY27 |
| Financial year | January–December | January–December | April–March |
| Months covered | Apr–Jun 2026 | Apr–Jun 2026 | Apr–Jun 2026 |
| Results published | 10 Jul 2026 | 4 Aug 2026 | 20 Jul 2026 |
| Accounting framework | US GAAP | IFRS | IFRS |
Profit measures
| Metric | Delta Air Lines | Lufthansa Group | Ryanair |
|---|---|---|---|
| Revenue (statutory) | $19,757m | €11,141m | €4,384.1m |
| Revenue (adjusted) | $17,666m (excl. refinery sales) | n/a | n/a |
| Operating profit (statutory) | $1,864m | EBIT €346m | €575.4m |
| Operating profit (headline) | Adjusted $1,563m | Adjusted EBIT €383m | Same as statutory |
| Statutory margin | 9.4% | 3.1% | 13.1% (calc.) |
| Headline margin | 8.8% | 3.4% | 13.1% (calc.) |
| Net profit | $1,604m | €123m | €538m |
Traffic and unit metrics
| Metric | Delta Air Lines | Lufthansa Group | Ryanair |
|---|---|---|---|
| Capacity | 78,694m ASM (≈126,646m ASK, calc.) | 86,939m ASK (−4%) | Not reported quarterly |
| Passengers | Not in release | 35.6m (−4%) | 61.3m (+6%) |
| Load factor | 84.8% (−0.7 pts) | 82.5% group; 81.6% network airlines | 94% (flat) |
| Unit revenue | TRASM adj. 22.45¢ (+12.4%) | Network airlines unit revenue +6.4% | Revenue per passenger €71.5 (−5%) |
| Unit cost | CASM-Ex 14.09¢ (+6.8%) | Network airlines CASK ex fuel and emissions +3.1% | Cost per passenger €62.1 (+5%); ex fuel €34.6 (+1.7%, calc.) |
| Fuel | Adj. $3.93/gal (+75%) | ≈€750m higher fuel cost | €1,689m (+16%); 80% of FY27 hedged at ≈$67/bbl |
Leave a Reply